Become a Kiwa PVEL Premium Partner
Receive more detailed Scorecard data every quarter, sent directly to your inbox.
The percentage of DH BOMs with <2% power loss increased to 69% in the past year, up from 62% in the previous year, but DH failures hit an all-time high. The biggest contribution to the high failure rate was the 23% of DH BOMs experiencing at least one delamination failure.
BOMs are DH Top Performers
Manufacturers are DH Top Performers
of BOMs had a DH failure
The PQP’s Damp Heat (DH) test is 2000 hours, double the duration of the IEC/UL certification test. For susceptible modules, this test instigates long-term degradation and failure modes that are typical in high temperatures and high humidity conditions where moisture and heat can weaken the materials binding the module together. When these bonds weaken due to low-quality components and/or substandard lamination processes, moisture can enter the laminate and cause corrosion and/or delamination.
This is an improvement from the 2025 Scorecard where 62% of DH BOMs had <2% degradation. The median degradation for DH BOMs produced in 2025 was 1.7% compared to 1.8% for BOMs produced in 2024. While this is not a statistically significant difference, there was a notable decrease in DH power loss outliers. See the Power Degradation graph below for more.
Failures detected during DH testing included 23% of DH BOMs experiencing a delamination failure, 5% of DH BOMs experiencing a power loss failure, 3% of DH BOMs experiencing a safety failure, and 2% of DH BOMs having the junction box lid fall off during testing. See the Failures
Most delamination failures following DH occurred on BOMs with relatively thick encapsulant, so the use of thinner encapsulants did not necessarily increase this risk. However, BOMs using front EPE or POE had a higher rate of both major and minor delamination occurrences versus those using front EVA. No 2026 Scorecard BOMs using n-type cells utilized front EVA.
Kiwa PVEL has observed a correlation with BOMs using shorter encapsulants having a higher likelihood of delamination failures than BOMs where the encapsulant length exceeds the glass length. However, the lamination process conditions are likely an even more critical factor in preventing delamination, but further analysis is needed.
Delamination was one of the top PQP failures over the past year, with multiple glass//glass BOMs for a wide range of module manufacturers exhibiting delamination and/or bubbles at the module perimeter. This is considered a major defect when those bubbles/delamination reduce electrical creepage distances to less than the minimum specified in IEC 61730. This example was one of those cases, where two BOMs from the same module manufacturer suffered significant delamination despite the use of two different encapsulant types. This issue is further discussed in Kiwa PI Berlin’s 2026 PV Module Manufacturing Quality Report
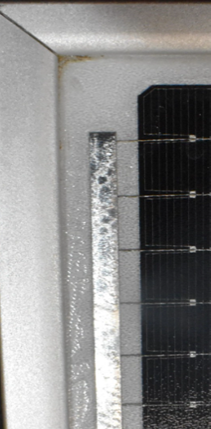
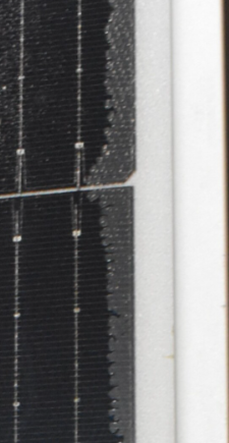
Two BOMs from the same module manufacturer exhibited major delamination defects following DH2000. In both cases, the bubbles/delamination reduced the electrical creepage distance to 0 mm, significantly below the IEC 61730 minimum of 10.4mm for 1500 V modules. Click on each image to see larger images.
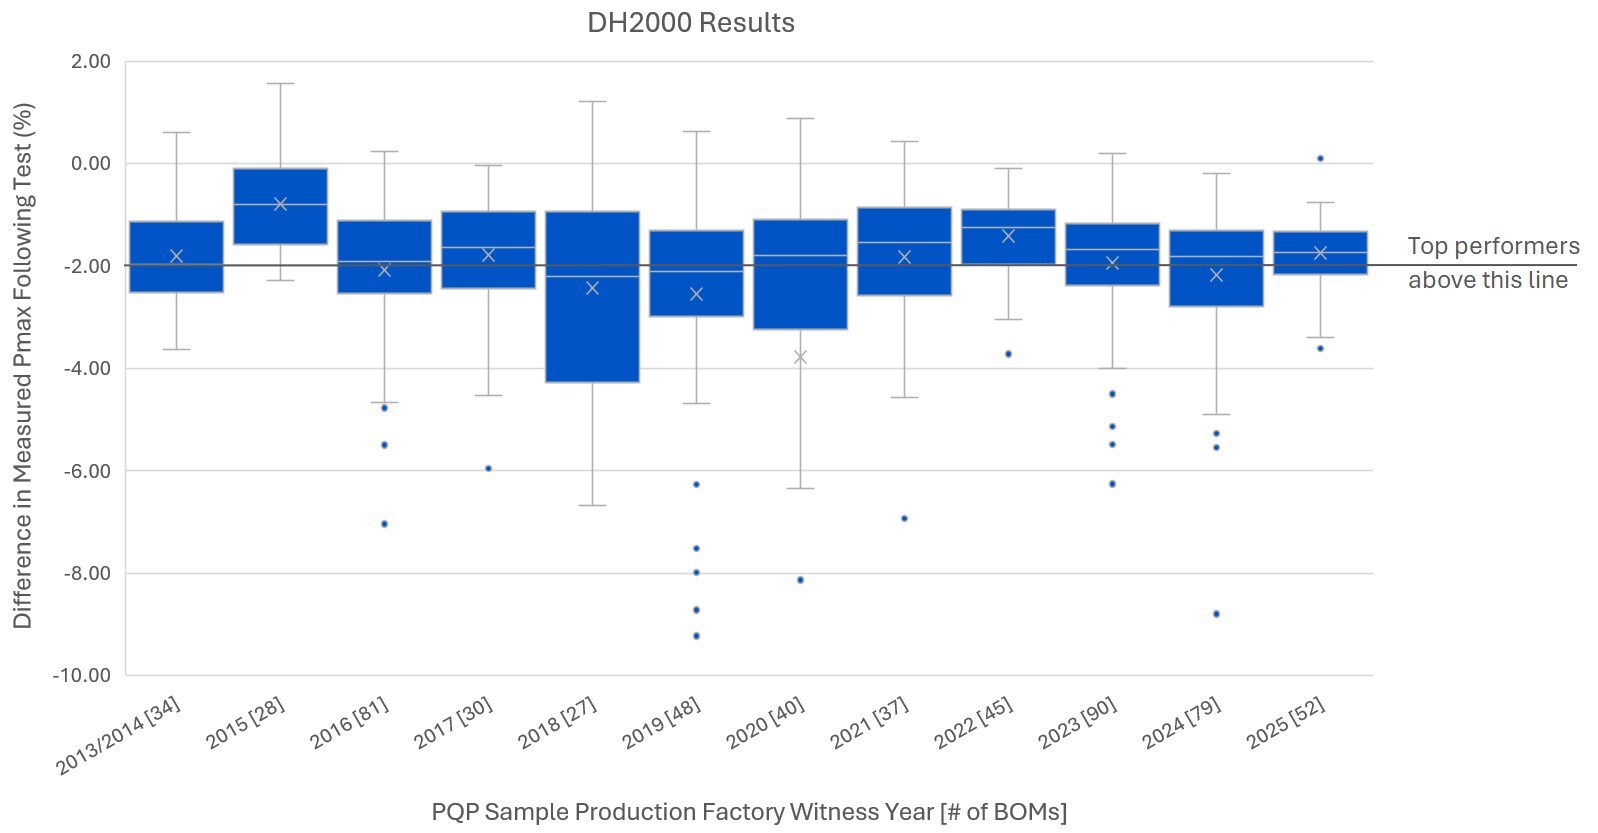
Percentage of results shown that are post-BO stabilization: 19% of 2018, 46% of 2019, 95% of 2020, 86% of 2021. All 2022 results and later are post-DH2000 (pre-BO stabilization), which is the stage in DH testing used to determine Top Performers.
Outliers with >10% degradation are not shown. In some cases, these cause a significant reduction in the mean.
Receive more detailed Scorecard data every quarter, sent directly to your inbox.