Become a Kiwa PVEL Premium Partner
Receive more detailed Scorecard data every quarter, sent directly to your inbox.
The median TC power loss has stayed relatively low (1.0%), but TC testing resulted in the highest number of PQP failures per test, with 37% of TC tested BOMs experiencing at least one failure. Thinner encapsulants and less silver usage as well as poor junction box designs have contributed to this increase in failures.
BOMs are tc top performers
Manufacturers are tc top performers
of boms had a tc failure
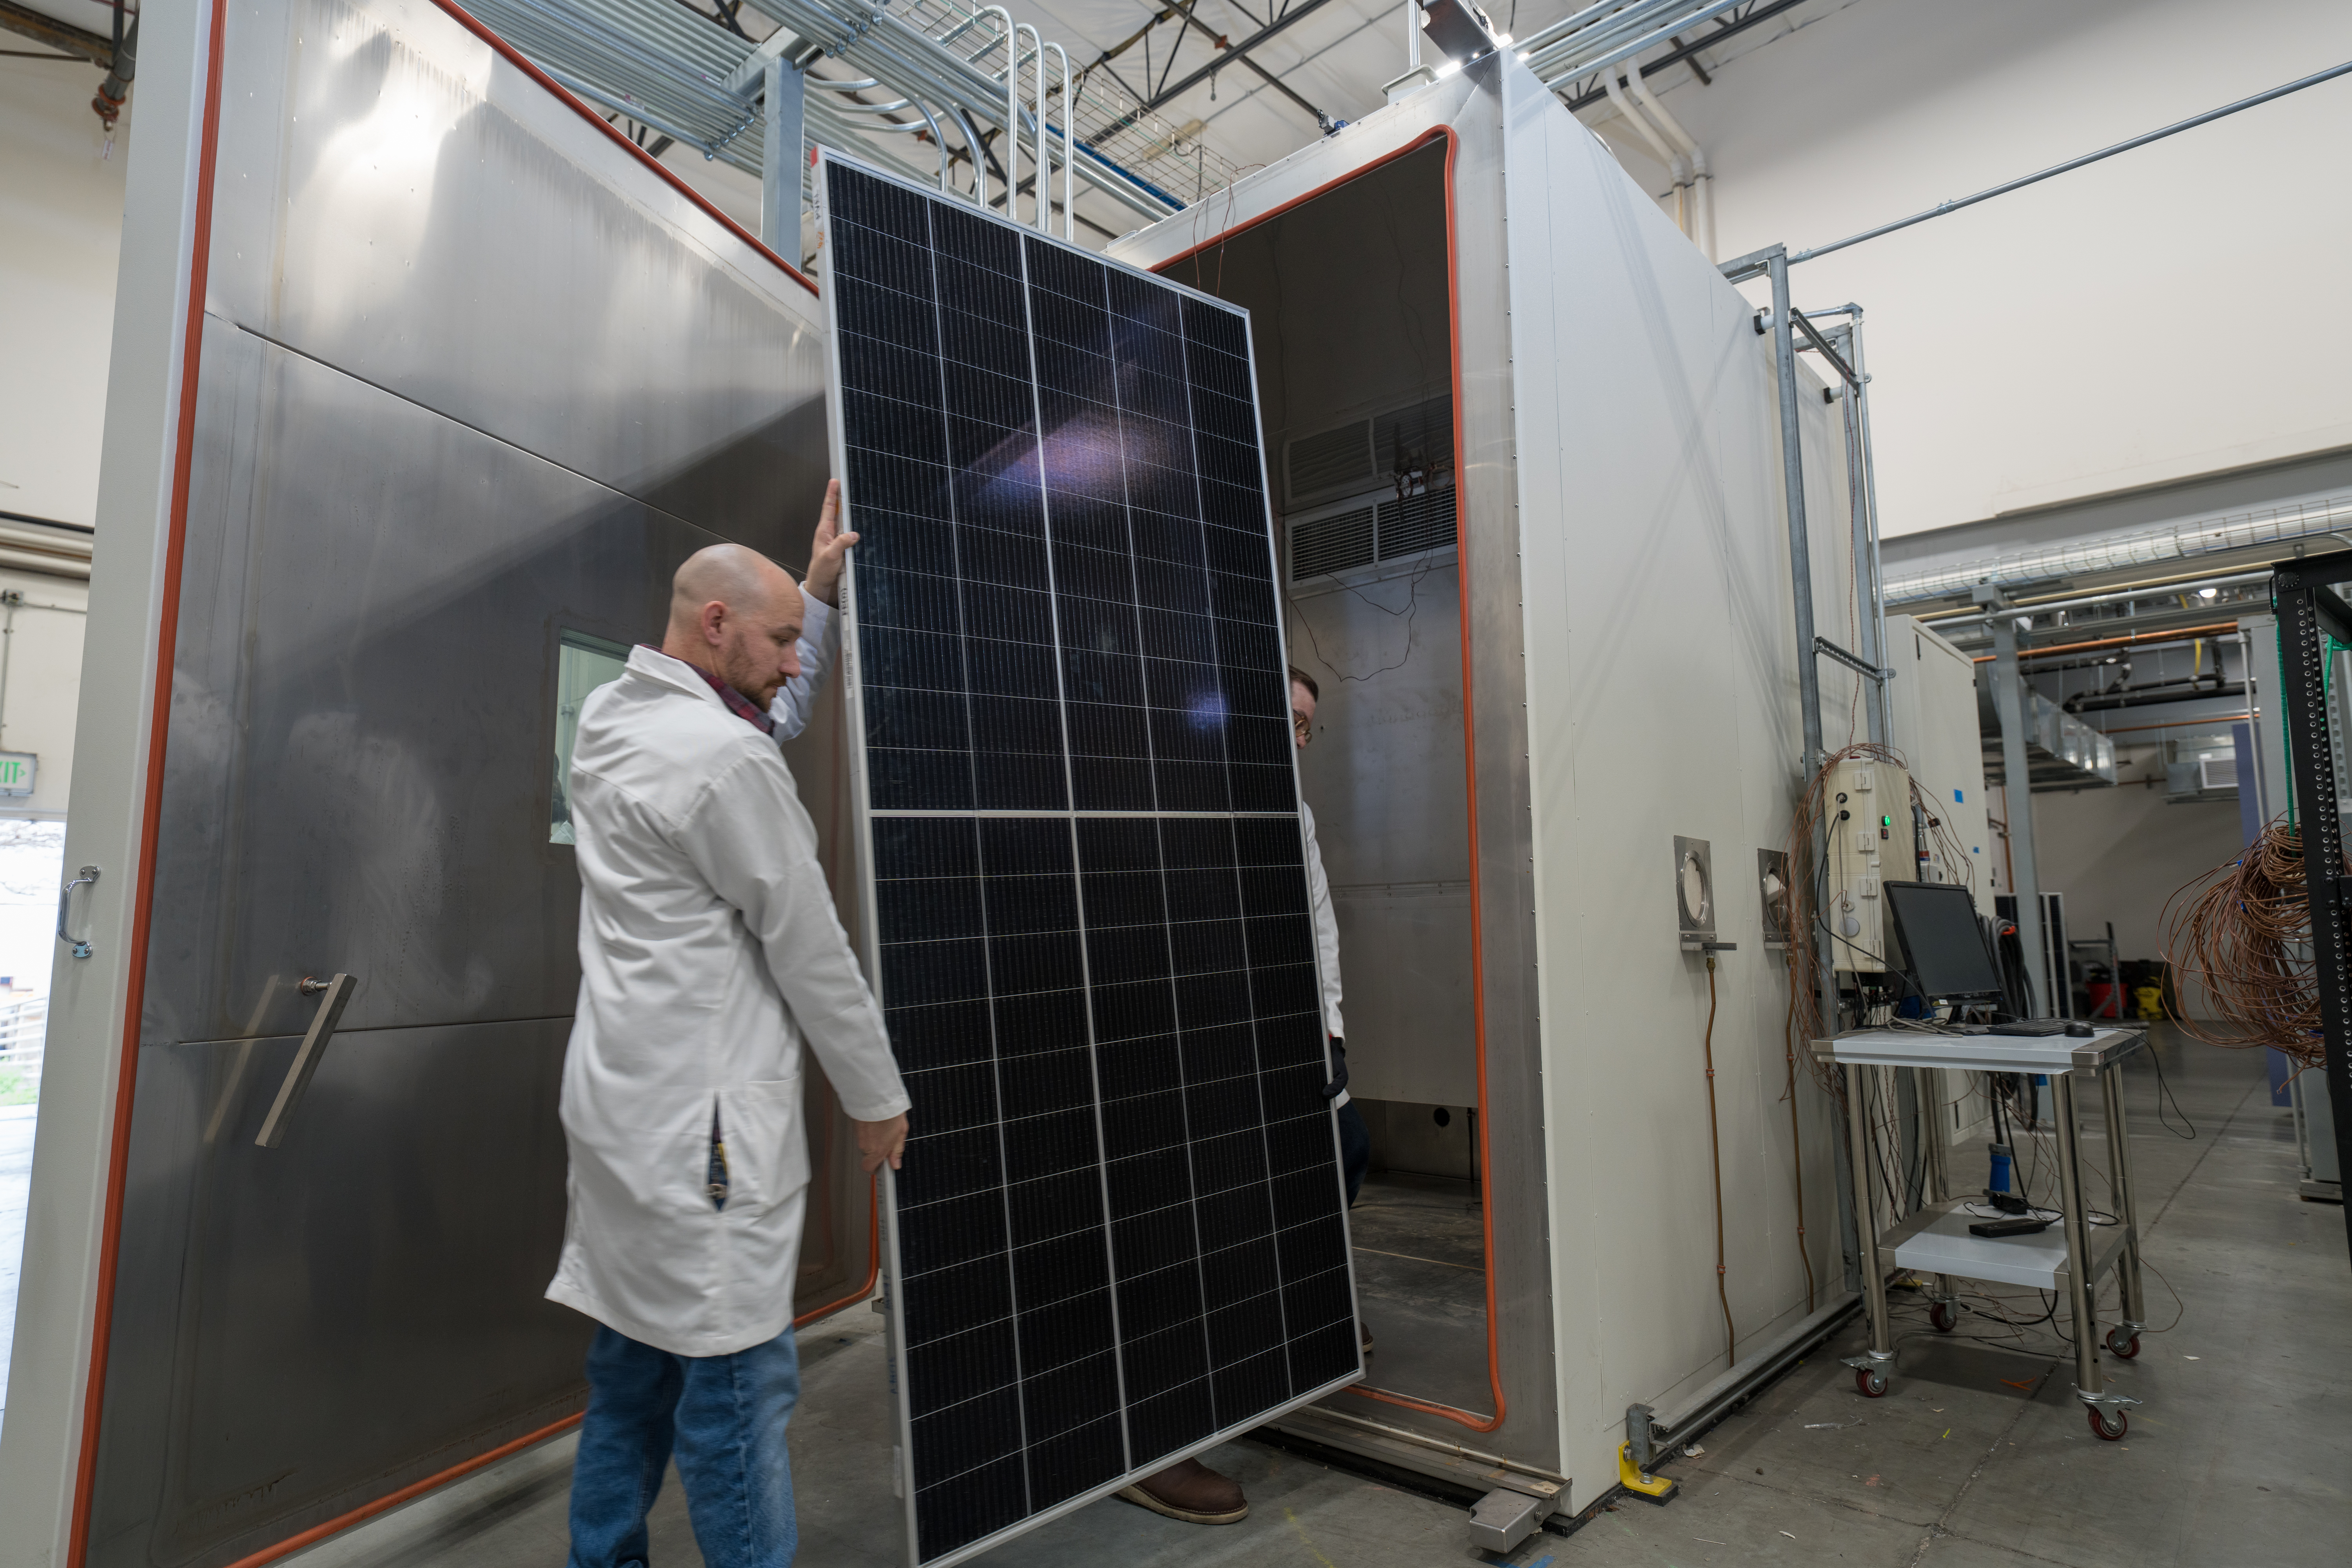
The PQP's Thermal Cycling (TC) test extends the IEC/UL certification test from 200 to 600 cycles, more accurately simulating a PV module's lifespan of temperature fluctuations. TC's extreme temperature swings stress module components, degrading interfacial bonds within the module and junction box that could substantially reduce performance. This test is crucial for environments with significant day-to-night temperature differences.
This is an improvement from the 2025 Scorecard where 71% of TC BOMs had <2% degradation; however, the median degradation for TC BOMs produced in 2025 remained at 1.0%, matching the median for BOMs produced in 2024. While TC power loss typically remains low, the number of TC failures is at an all-time high. See the Power Degradation graph below for more.
Failures detected during TC testing included 15% of TC BOMs experiencing a delamination failure, 15% of TC BOMs experiencing a failed bypass diode, 5% of TC BOMs experiencing a safety failure, 2% of TC BOMs experiencing a power loss failure and 2% of TC BOMs having the junction box lid fall off during testing. See the Failures page for more.
Reducing encapsulant thickness is a common cost‑cutting measure adopted by manufacturers, but this raises reliability risks. For example, >70% of BOMs with >2% power loss following TC600 used front encapsulant with area weight in the lower quartile range (≤400 g/m2). Thicker encapsulants are more forgiving under the extreme temperatures of TC testing.
Busbar-free technology (also known as 0BB or ZBB) eliminates the busbars on solar cells. Instead, the module’s cell interconnect ribbons collect the current from cell fingers directly. This innovation reduces silver consumption and boosts module efficiency, but ZBB BOMs have a wider range of TC power loss (0.6% to 8.4%) versus BOMs utilizing traditional cell busbars.
Cost cutting measures such as changes or reductions in metallization and/or encapsulant can lead to TC failures. That was the case here where the module power loss increased linearly with the number of thermal cycles due to poor connections between the interconnect ribbons and the cell solder pads. This resulted in the post-TC600 EL image showing 20-30% of the cell area appearing darkened along the top and bottom edge of most cells, indicating higher resistance areas at those solder pads. Analysis by Kiwa PVEL indicated that a reduced amount of metallization and encapsulant were the likely root cause.
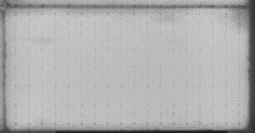
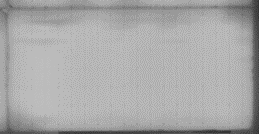

Dark areas on the last soldering pad increased over the test duration, leading to power loss. Click on each image to see the corresponding full-size EL image.
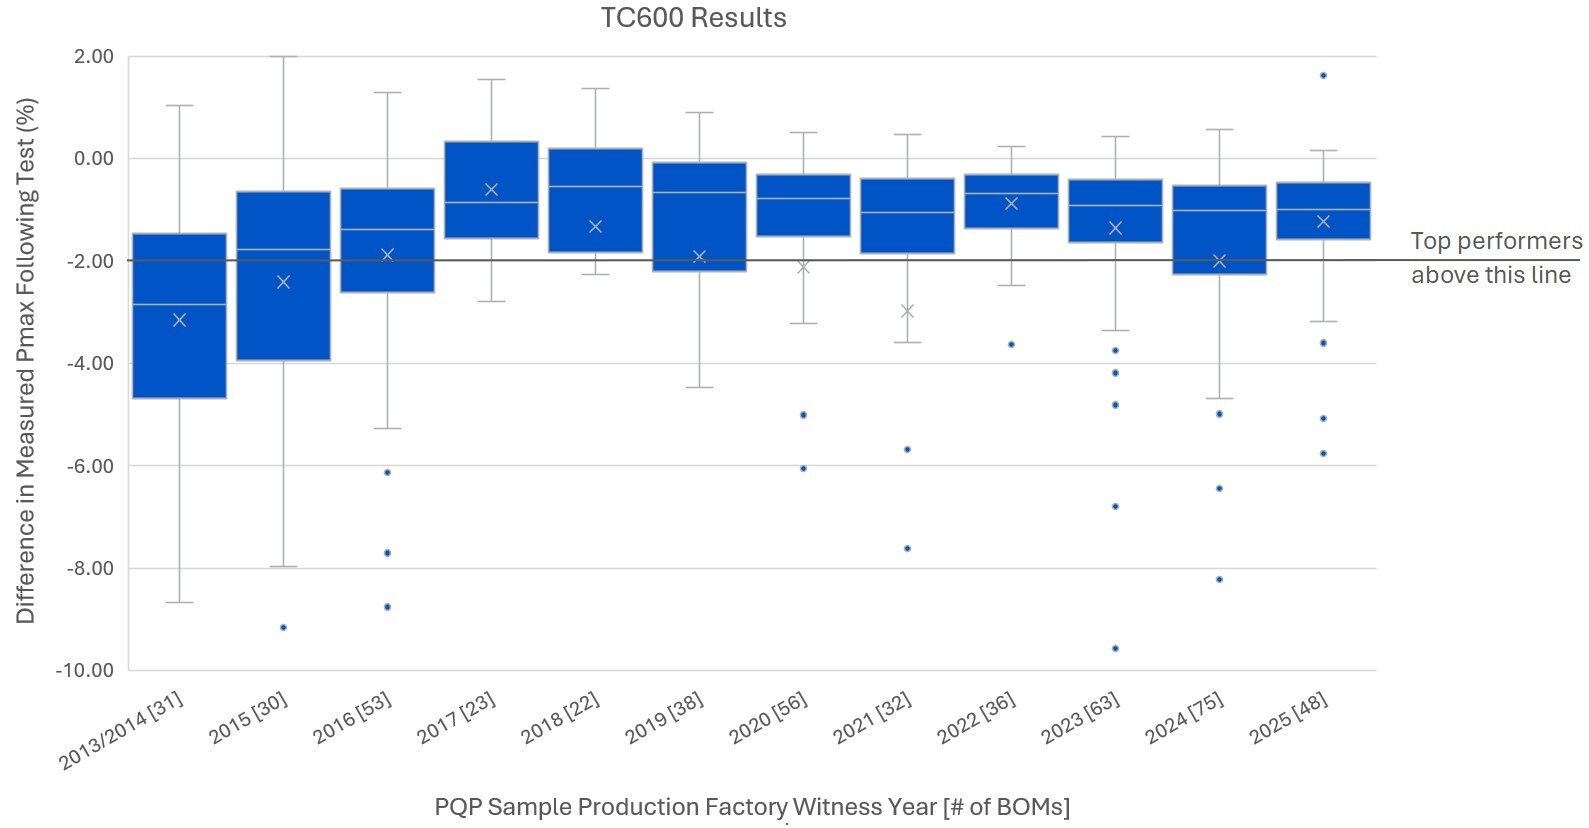
Outliers with >10% degradation are not shown. In some cases, these cause a significant reduction in the mean.
View Box Plot Interpretation GuideReceive more detailed Scorecard data every quarter, sent directly to your inbox.