Become a Kiwa PVEL Premium Partner
Receive more detailed Scorecard data every quarter, sent directly to your inbox.
The number of BOMs having >1% power loss in LID+LETID increased over the past year, as did the number of failures occurring during initial characterizations, LID and/or LETID. The increased power loss may be attributed to an increase in the number of new cell factories used for modules undergoing PQP testing.
BOMs are LID + LETID Top Performers
Manufacturers are LID + LETID top performers
BOMs had an initial LID + LETID failure
The PQP's Light Induced Degradation (LID) and Light and Elevated Temperature Induced Degradation (LETID) tests quantify these cell-based phenomena that are often incorporated into energy yield models. LID varies by cell technology but primarily impacts boron-doped cells and stabilizes shortly after module deployment. LETID most predominantly affected early generation PERC cells and is more severe in hotter climates. Degradation from LETID reaches its maximum point after months or years.
This is down from the 93% of BOMs with <1% reported in the 2025 Scorecard, with the median and average results slightly increasing for BOMs produced in 2025 versus 2024 (although not statistically significant). New cell factories may explain this change. See the Power Degradation graph below for more.
Failures detected during initial, LID and LETID testing included 6% of BOMs experiencing a delamination failure during initial characterizations, 3% of BOMs experiencing a safety failure during initial characterizations or LETID testing, 3% of LID BOMs experiencing a power loss failure, and 1% of LID BOMs experiencing module breakage. See the Failures page for more.
The median LID power loss for 2026 Scorecard eligible BOMs was 0.4% for TOPCon, 0.6% for PERC, 0.7% for HJT and 0.6% of xBC. While the sample sizes were quite low for HJT and xBC, the increase in median LID rates for cell technologies other than TOPCon is notable.
The median LETID power loss for 2026 Scorecard eligible BOMs was 0.1% for TOPCon, 0.1% for PERC, 0.4% for HJT and 0.1% for xBC. Despite these low median amounts across cell technologies, the maximum LETID power loss was 1.4% for one TOPCon BOM, signifying that this failure mode has not been completely eliminated.
The introduction of gallium-doped PERC and n-type cell technologies caused LID to reach negligible levels over the last few years; however, novel dopants may change this trend. This was the case with a recent n-type TOPCon BOM doped with a combination of phosphorus and antimony (P+Sb). The average post-LID power loss was 1.9% for this BOM, making it the highest LID result since boron-doped PERC BOMs in 2020. Additional research is recommended for co-doped P+Sb as the mechanism behind this degradation is currently unknown.
The post-LID EL image shows darkening throughout with a slight checkerboard pattern indicating inconsistent degradation rates across cells. Click on each image to see the corresponding full-size EL image.
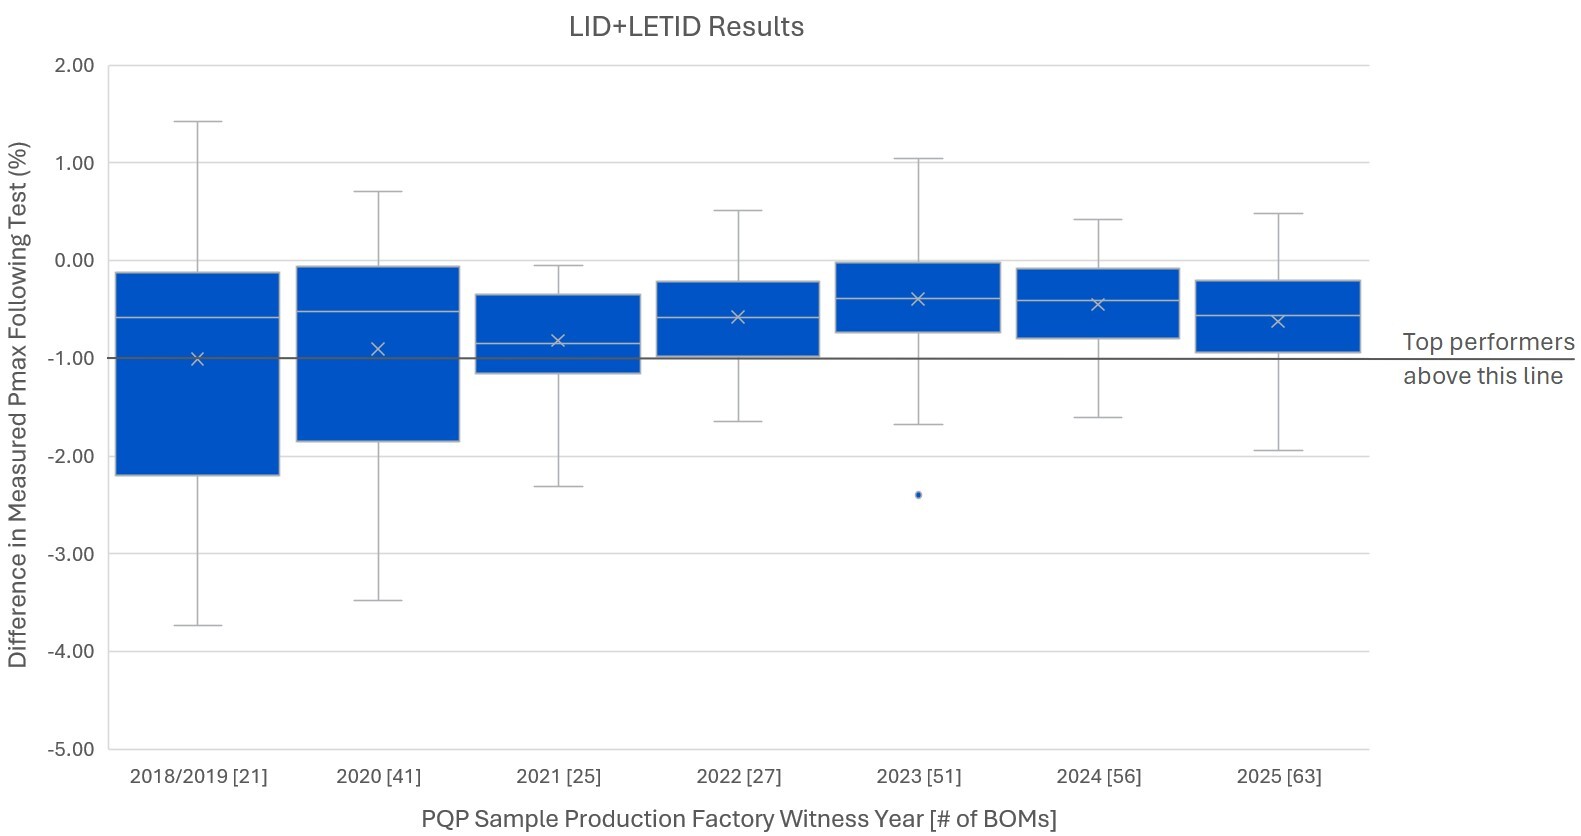
Before 2023, all results are average LID + average LETID486. 4% of 2023 results, 93% of 2024 results and all 2025 results are average LID + average post-CID to post-LID324.
View Box Plot Interpretation GuideReceive more detailed Scorecard data every quarter, sent directly to your inbox.