Become a Kiwa PVEL Premium Partner
Receive more detailed Scorecard data every quarter, sent directly to your inbox.
PID results improved over the past year, with 82% of BOMs produced in 2025 having <2% power loss following PID(-). But PID remains a relevant reliability concern with 15% of PID BOMs suffering a PID failure and one BOM exhibiting non-recoverable PID power loss >20%.
BOMs are PID Top performers
Manufacturers are PID top performers
of BOMs had a PID failure
The PQP’s Potential Induced Degradation (PID) test doubles the IEC/UL certification test duration to 192 hours. PID occurs primarily in electrically ungrounded PV systems with high voltages, especially those using transformerless inverters. Of the different forms of PID, PID-shunting occurs when sodium ions from the glass travel to pinholes in the anti-reflective coatings on the cells, permanently lowering performance. While PID-polarization is static charge build-up due to internal circuit voltages, and is possibly reversible.
This is an increase from the 72% of BOMs produced in 2024 that degraded by <2%, and represents a statistically significant change. The median degradation following PID(-) decreased from 1.5% for BOMs produced in 2024 to 1.1% for BOMs produced in 2025. The average PID(-) power loss also improved. See the Power Degradation graph below for more.
Failures detected during PID testing included 6% of PID BOMs experiencing a power loss failure, 5% of PID BOMs experiencing a delamination failure, 2% of PID BOMs experiencing a safety failure, and 1% of PID BOMs experiencing a failed bypass diode. See the Failures page for more.
Five out of the six BOMs with PID power loss failures were affected by PID-polarization. While this degradation is typically reversable following a short UV exposure, there have been reports of PID-polarization occurring in the field under certain site conditions.
There was only one BOM in the 2026 Scorecard dataset with <2% degradation for PID(-) and ≥2% degradation for PID(+), stopping it from being a Top Performer. Conversely, 18% of BOMs with <2% degradation for PID(+) had ≥2% degradation following PID(-).
Despite PID-shunting (PID-s) being a well-known failure mode, cases of PID-s continue to be seen on some BOMs. One recent BOM exhibited particularly high PID-p power loss (>20%) following PID192(-), mainly driven by fill factor losses. Notably, the performance degradation under low irradiance was even worse, at almost 30%. Post-PID192(-) EL images showed a 'checkerboard' pattern accompanied by intensified edge darkening. The manufacturer submitted new PQP samples for a PID retest and achieved <2% following PID192(-). This demonstrates that strong quality control of cells is both possible and necessary to ensure suitable PID resistance.
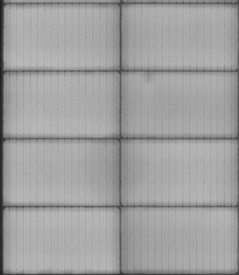
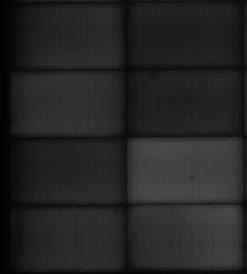
The initial image shows no indication of PID susceptibility, but after 192 hours of PID(-) testing, most cells show significant darkening due to an accumulation of PID-shunting. Click on each image to see the corresponding full-size EL image.
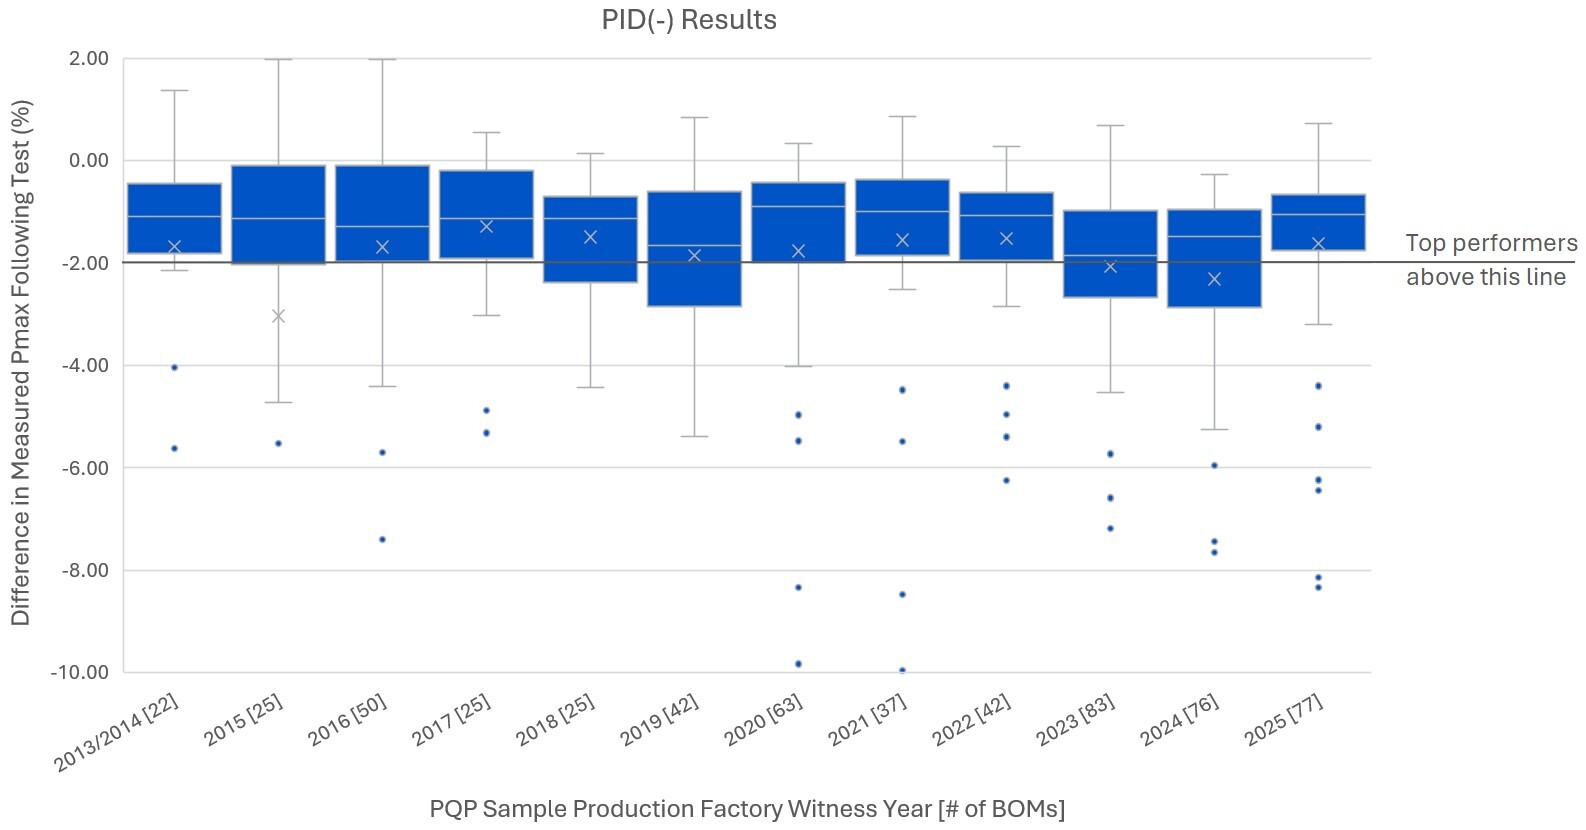
All 2013/2014 and 2015 results are from 600 hours of PID testing. This was decreased to 192 hours for 2016 results and beyond. Only PID-negative results are shown.
Outliers with >10% degradation are not shown. In some cases, these cause a significant reduction in the mean.
Receive more detailed Scorecard data every quarter, sent directly to your inbox.